Citation
Erik H. Schmidt, Megan M. Johnson and Debjani Singh. 2023. Existing Hydropower Assets State-level Capacity and Generation Map. HydroSource. Oak Ridge National Laboratory, Oak Ridge, Tennessee, USA.
Overview
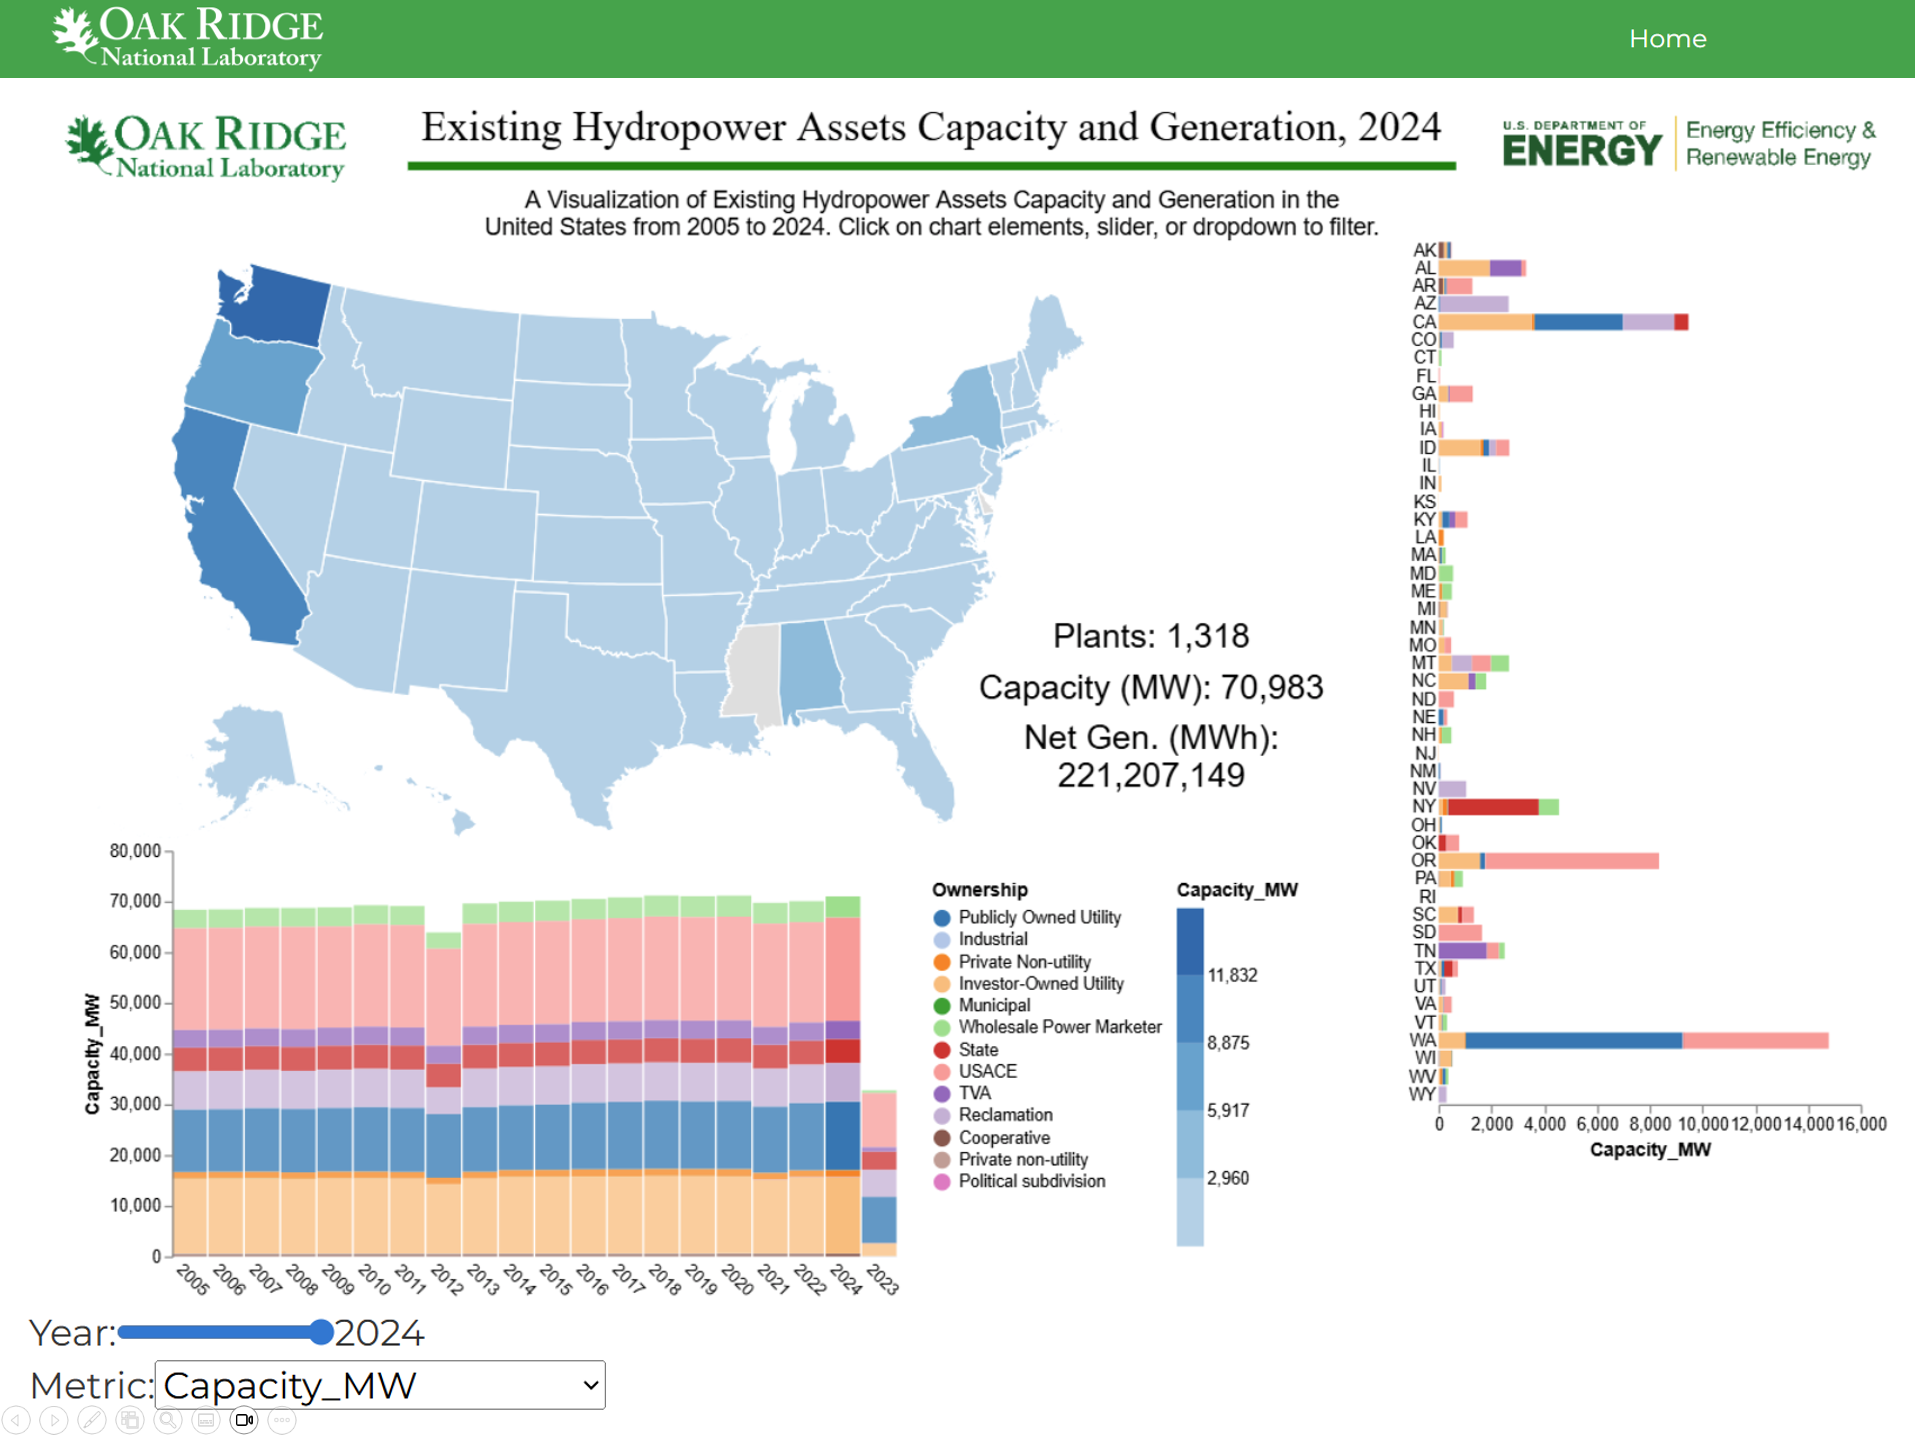
The interactive Existing Hydropower Assets State-level Capacity and Generation Map summarizes net electricity generation, generation capacity, and hydropower facility count by state and owner type from 2005-2024. Data is available for 1,213-1,385 US hydropower facilities varying by year. Generation data were obtained from the Existing Hydropower Assets (EHA) Net Generation Plant Database, 2003-2024 (Johnson, 2025) dataset which synthesizes data from US Energy Information Administration’s (EIA) Form EIA 923. Capacity data were obtained from Existing Hydropower Assets (EHA) Capacity Plant Database, 2005-2024 (Johnson, 2025) which synthesizes data from Form EIA 860. Pumped storage and hybrid plants are excluded.
Science Themes
Related Records
Existing Hydropower Assets (EHA) Net Generation Plant Database, 2003-2024
This dataset consists of data for Existing Hydropower Asset (EHA) Net Generation at both annual and monthly temporal scales along with, Existing Hydropower Asset (EHA) Annual Hybrid Net Generation at both annual and monthly temporal scales.
View DatasetExisting Hydropower Assets (EHA) Capacity Factor Plant Database, 2005-2024
Existing Hydropower Asset (EHA) Annual Capacity Factor is a geospatial point-level dataset containing annual capacity factors over the years (2005-2024) and key characteristics of operational U.S. hydropower plants with 1 megawatt or greater of nameplate capacity.
View Dataset