Citation
Erik H. Schmidt and Megan M. Johnson. 2026. Interactive Hydropower Generation Map, 2003-2024. Oak Ridge National Laboratory, Oak Ridge, Tennessee, USA.
Overview
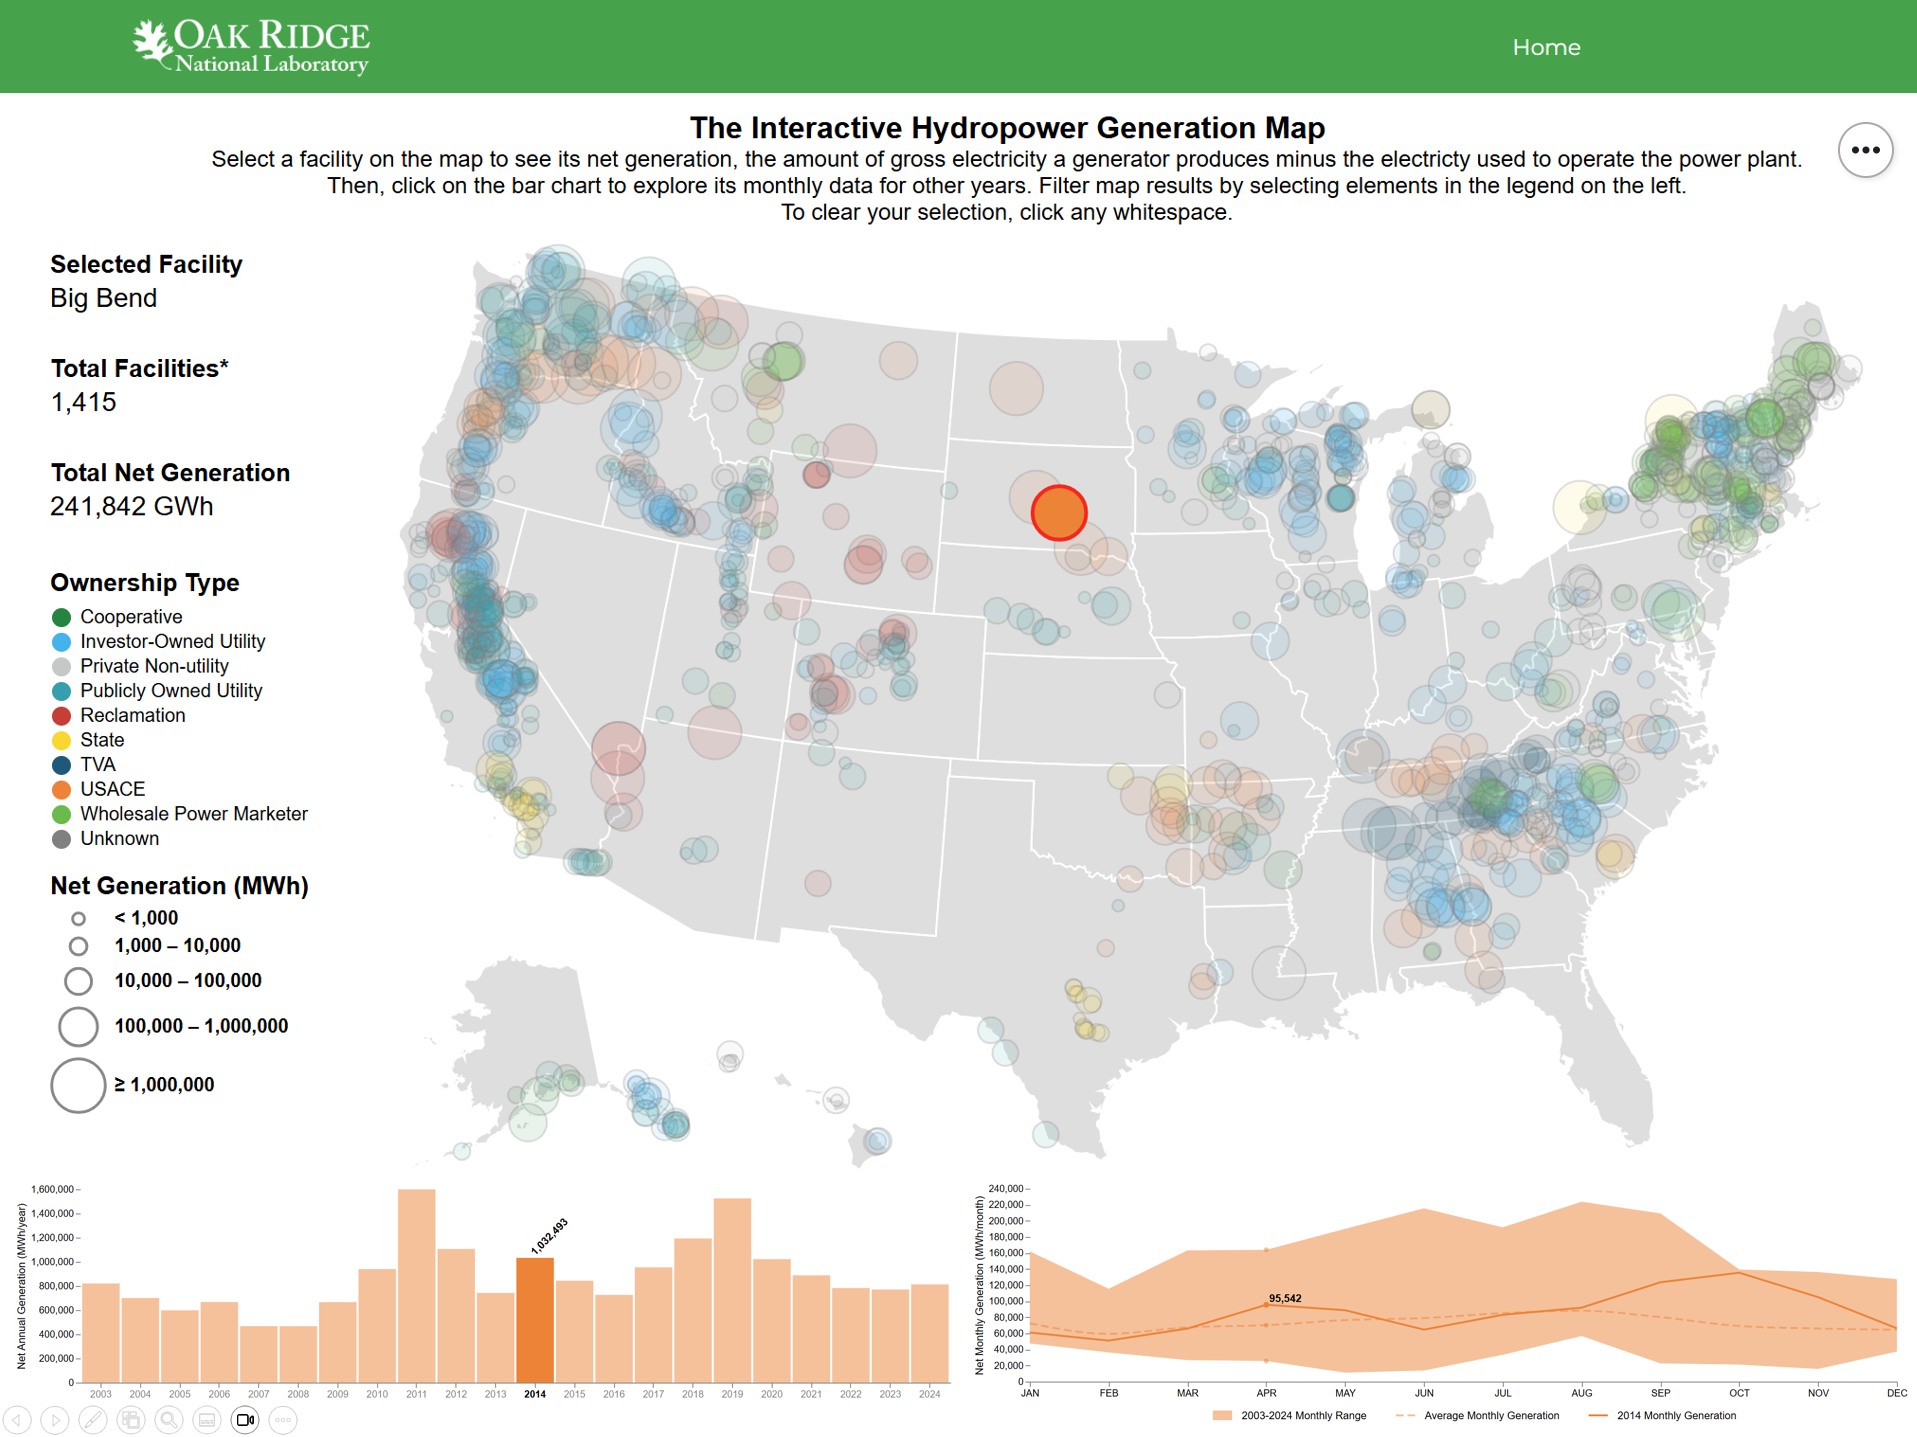
The Interactive Hydropower Generation Map displays net electricity generation from 2003-2024 for U.S. hydropower facilities with a generation capacity at least 1 MW. This map produces graphs of annual and monthly generation when a hydropower facility is selected. Generation data were obtained from the Existing Hydropower Assets (EHA) Net Generation Plant Database, 2003-2024 (Johnson, 2025) dataset which synthesizes data from US Energy Information Administration’s (EIA) Form EIA 923. Pumped storage and hybrid plants are excluded.
Keywords
Science Themes
Related Records
Existing Hydropower Assets (EHA) Net Generation Plant Database, 2003-2024
This dataset consists of data for Existing Hydropower Asset (EHA) Net Generation at both annual and monthly temporal scales along with, Existing Hydropower Asset (EHA) Annual Hybrid Net Generation at both annual and monthly temporal scales.
View DatasetExisting Hydropower Assets (EHA) Net Generation Plant Database, 2003-2025
This dataset consists of data for Existing Hydropower Asset (EHA) Net Generation at both annual and monthly temporal scales along with, Existing Hydropower Asset (EHA) Annual Hybrid Net Generation at both annual and monthly temporal scales.
View Dataset